Your whole portfolio is ready to report.
INVARIO is family office reporting software: allocation, drift from target and performance across every bank and asset, from figures checked against the bank each morning.

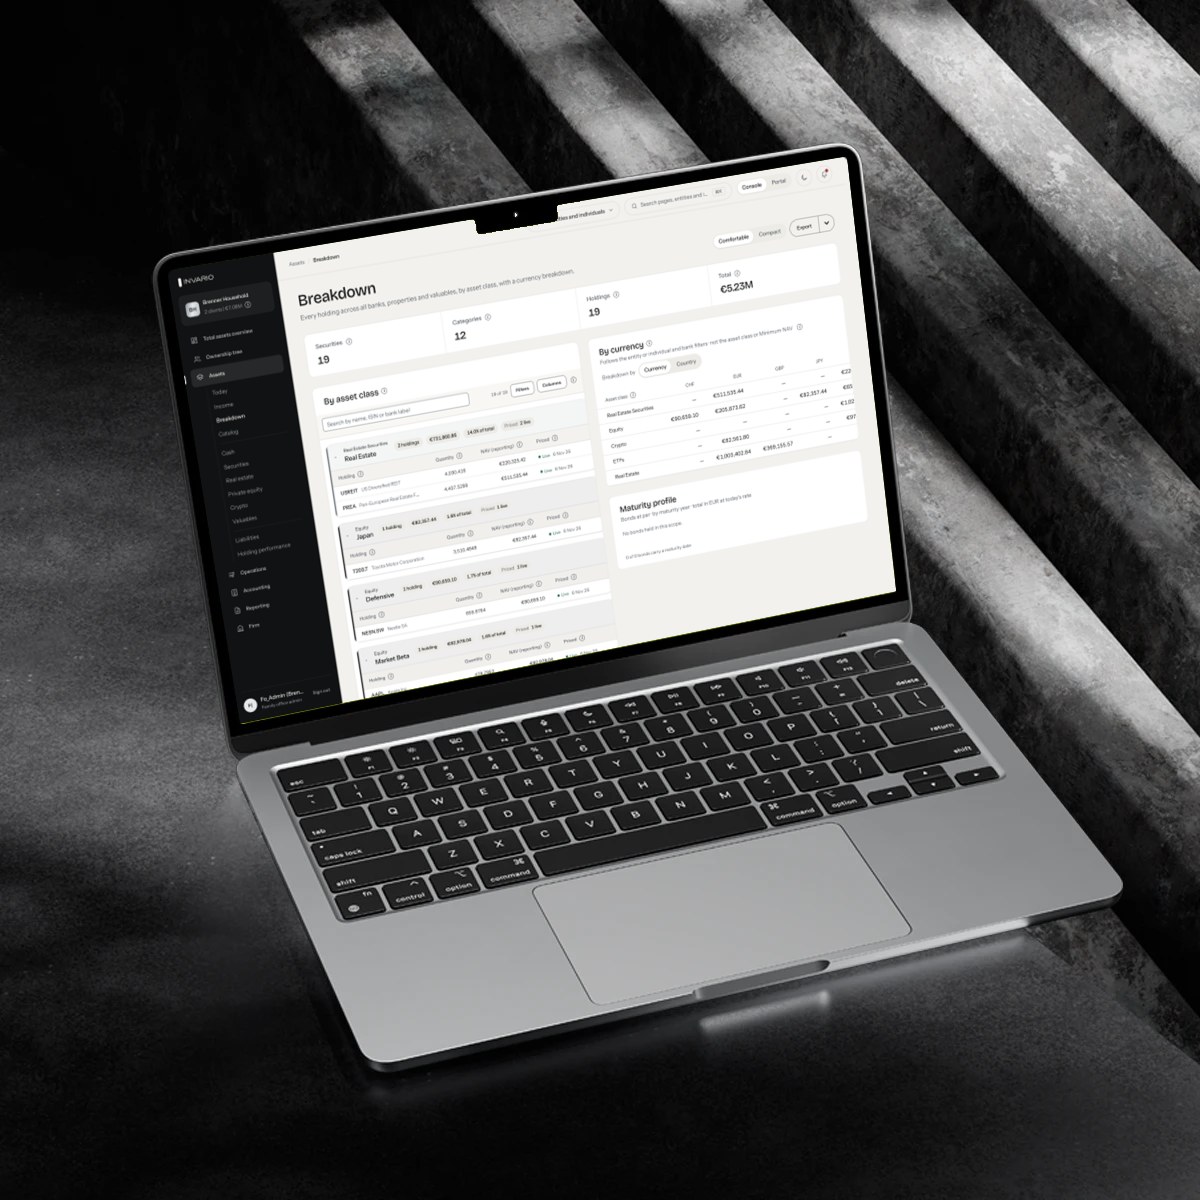
Allocation, performance and income from one ledger
Reports read from the double-entry ledger the office keeps its books in, after each holding is checked against the bank's own file that morning.
Allocation is shown by asset class, currency, geography, sector and custodian. Performance is a time-weighted return, which removes the effect of money added or withdrawn. A missing price is flagged, not counted as zero.
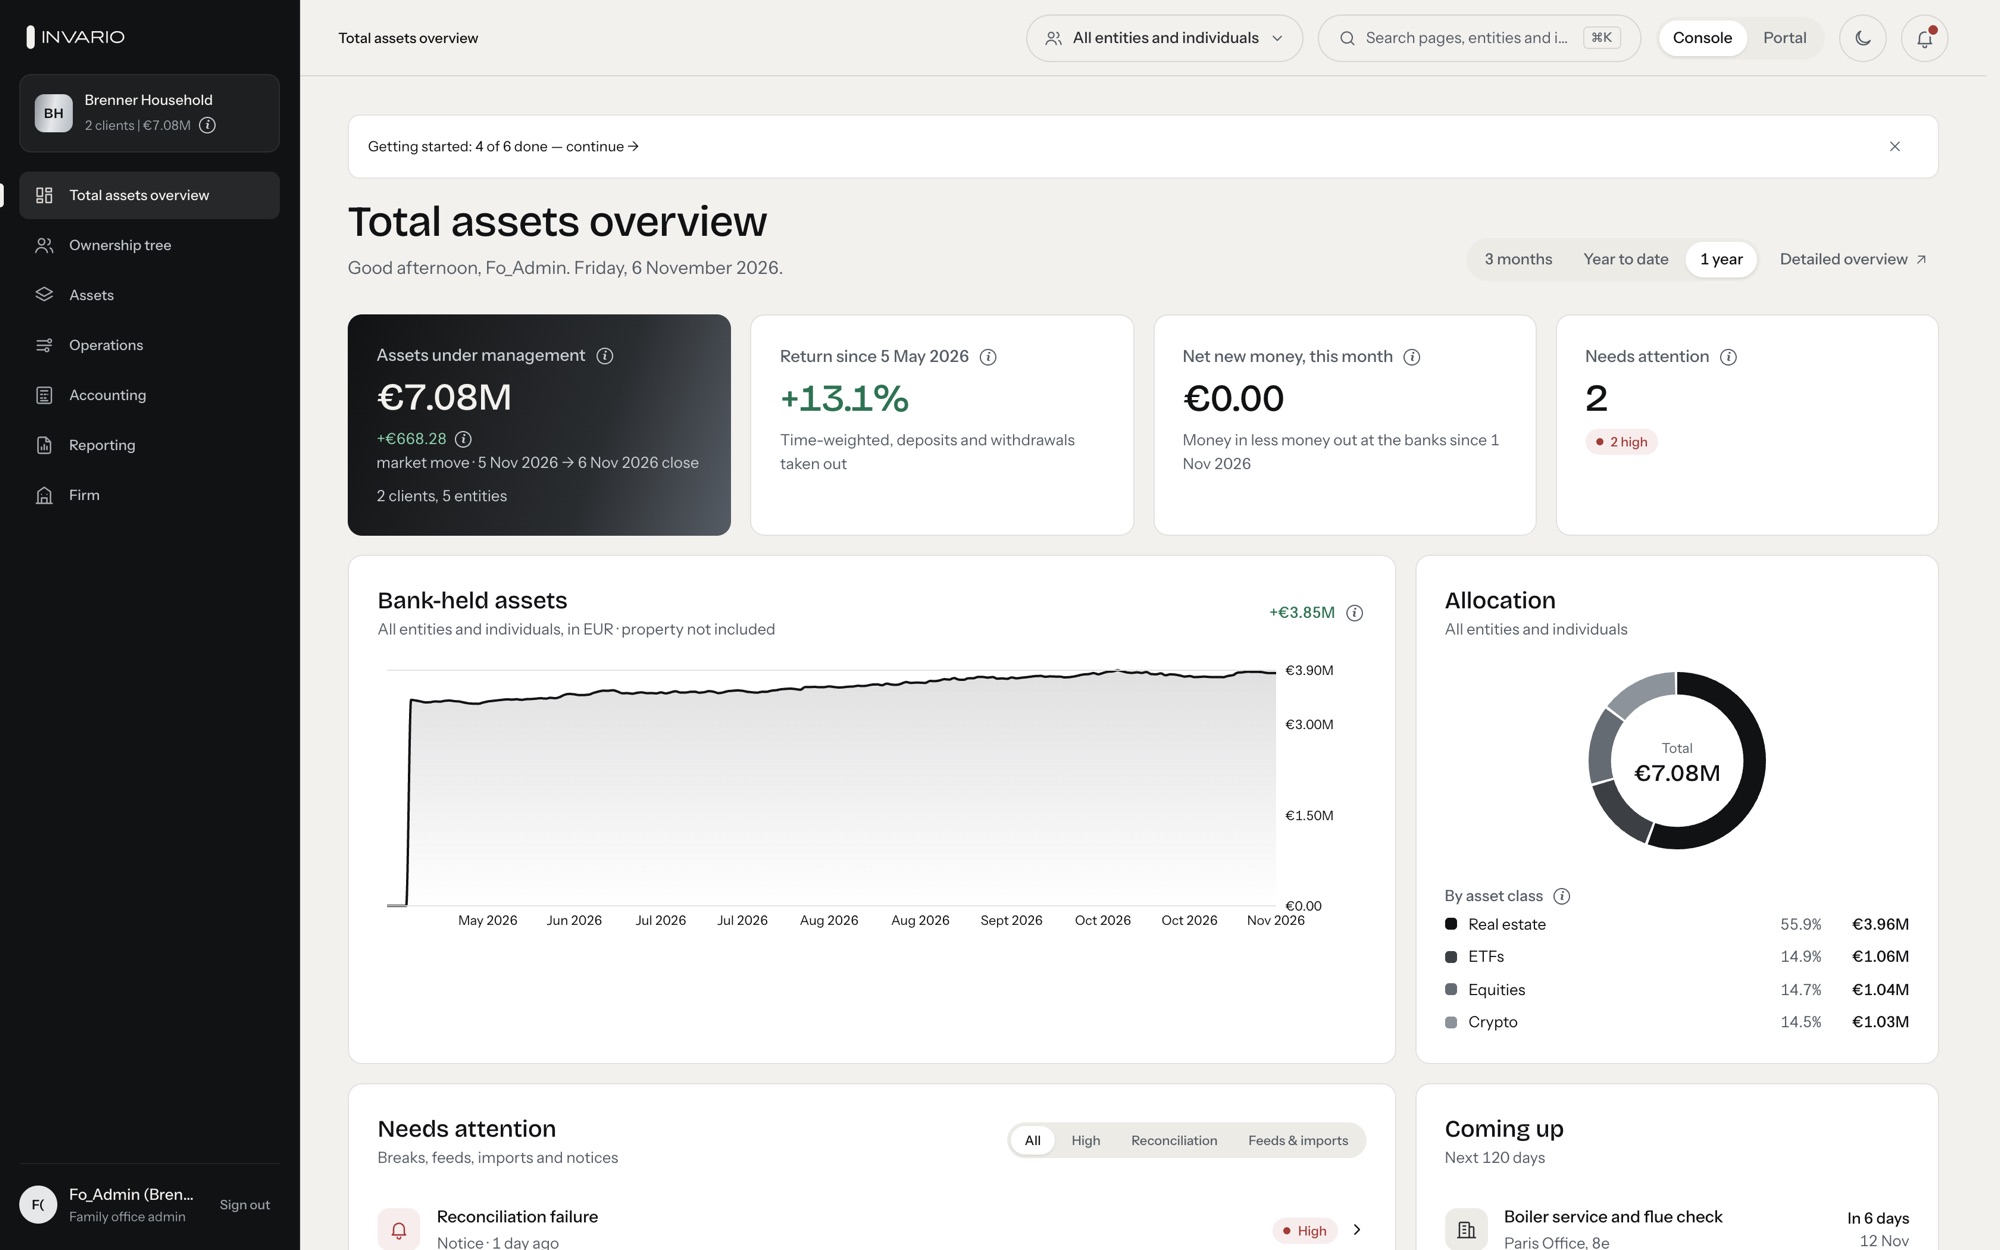
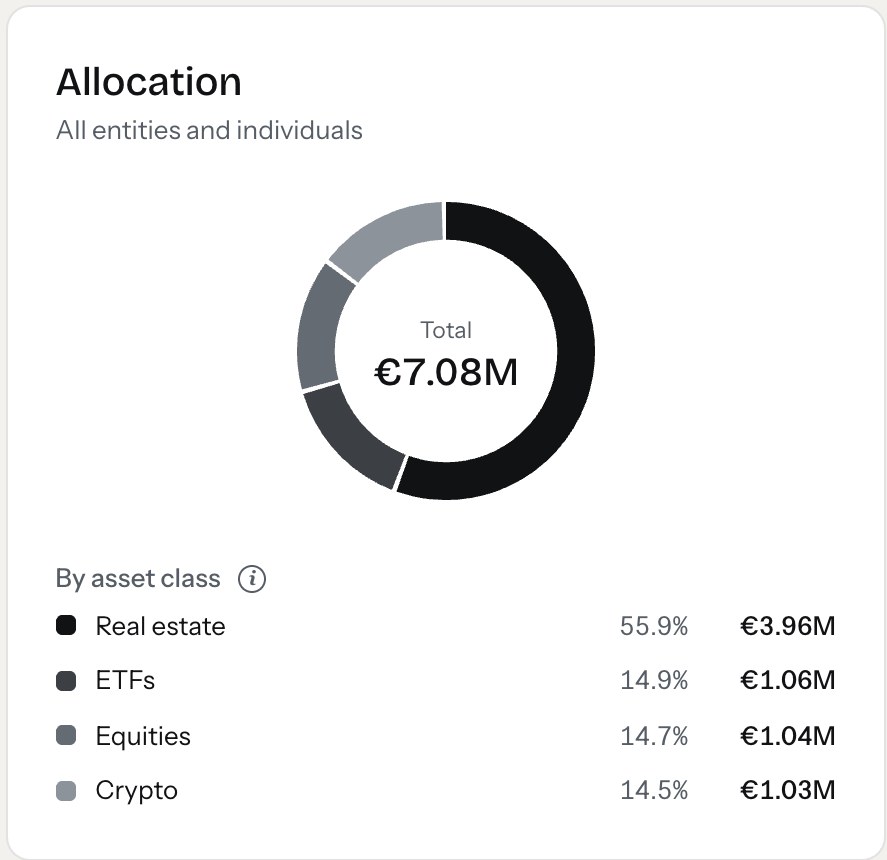
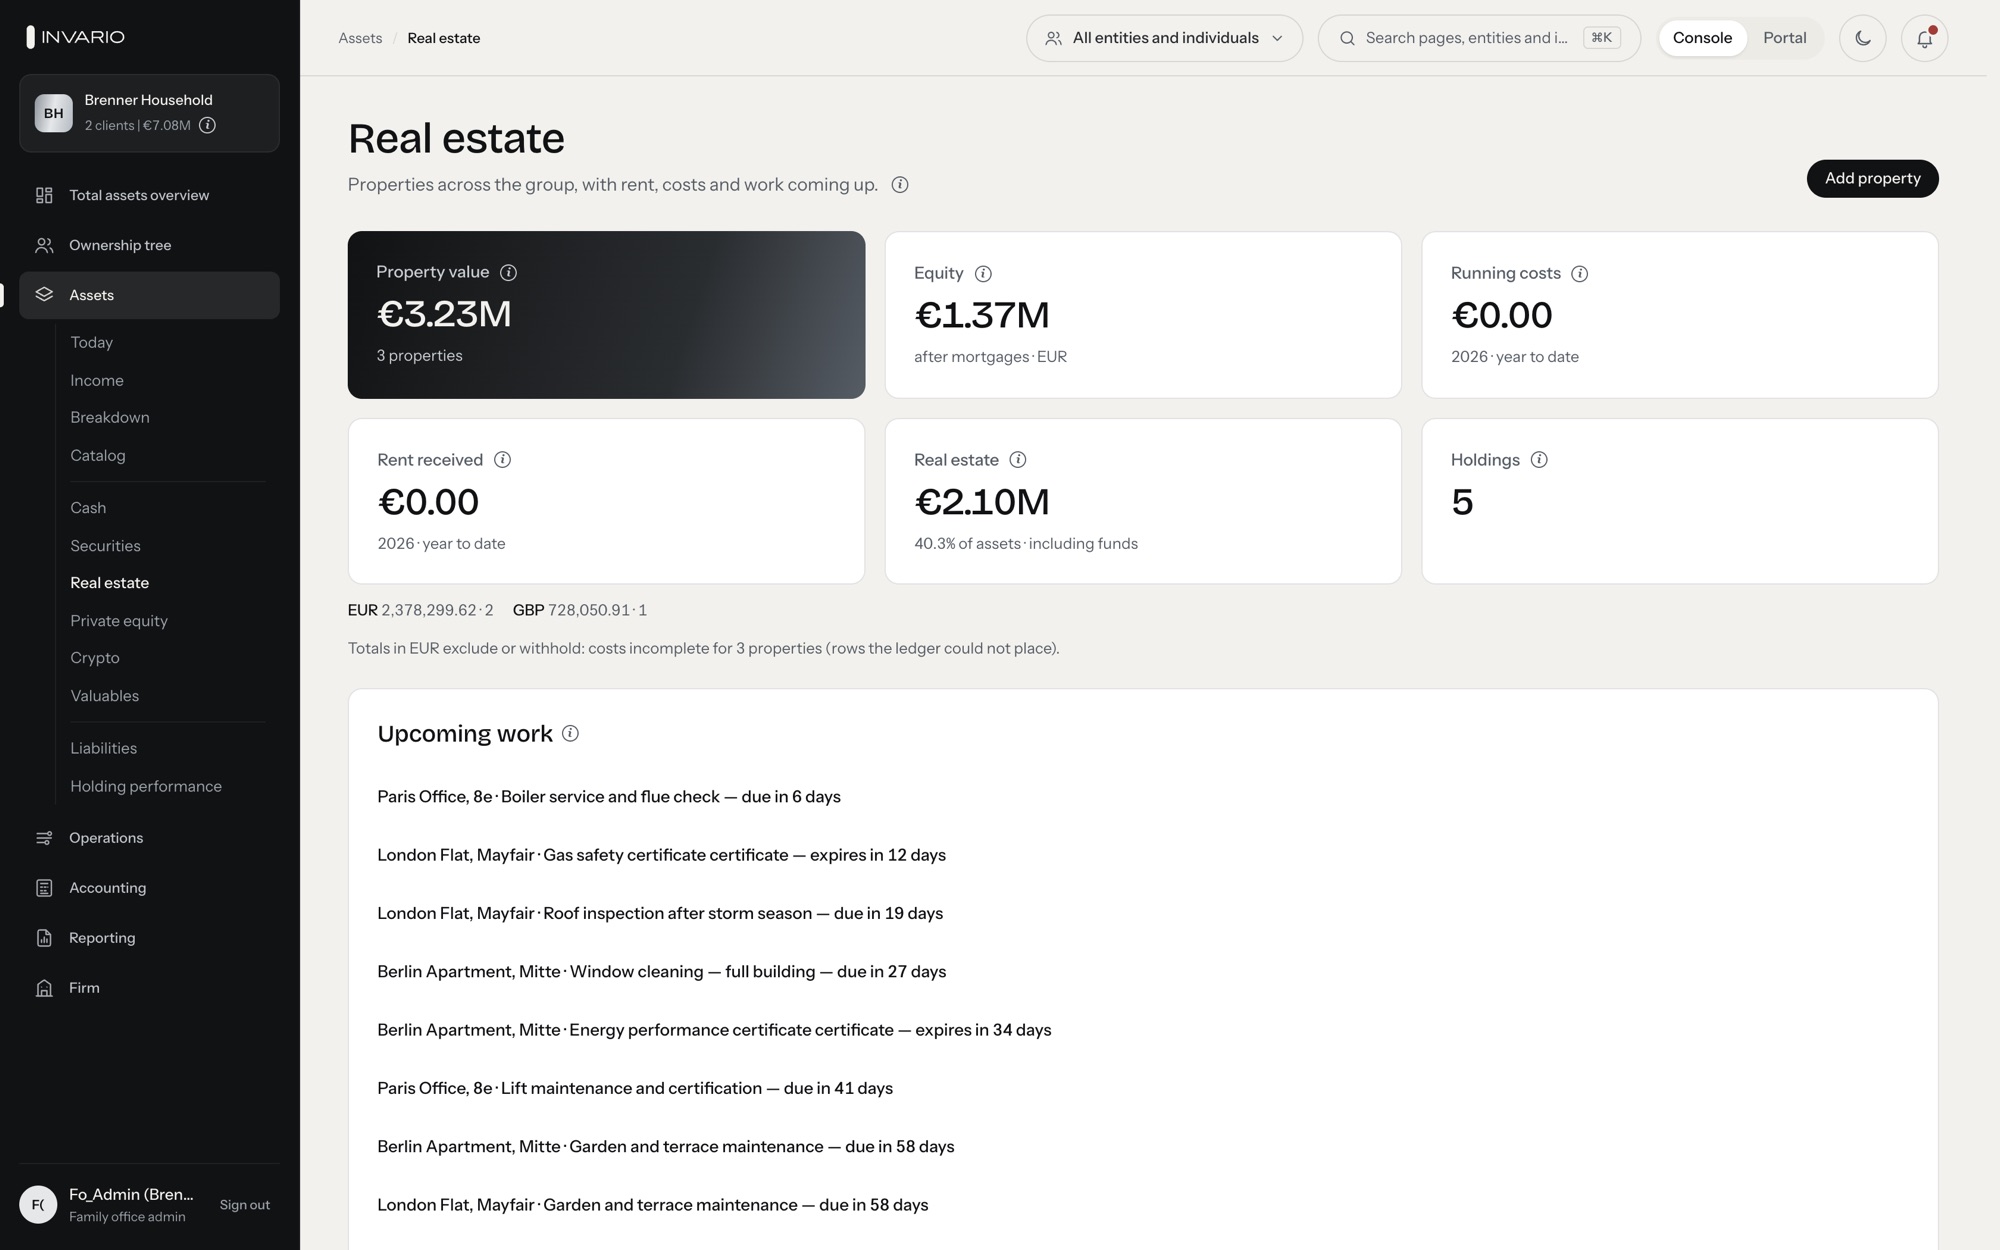
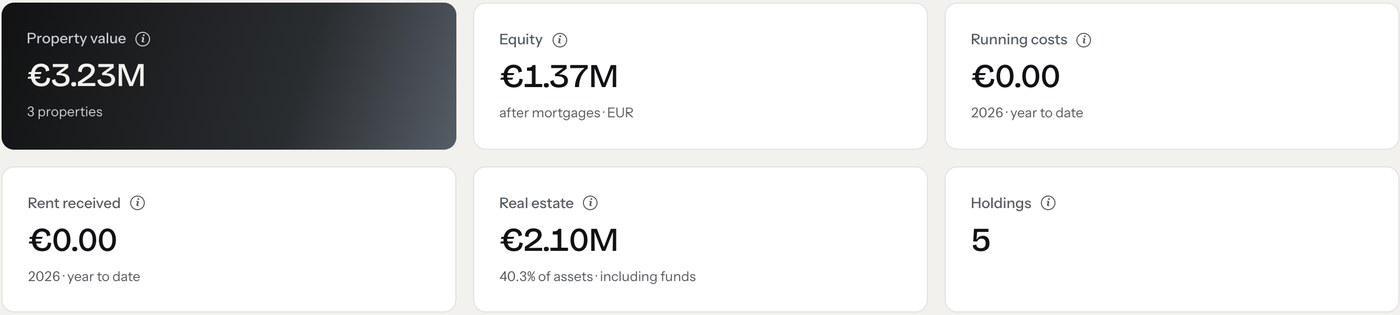
Property, funds and loans in the same reports
Every asset and liability appears in one report, counted once. A property carries its mortgage, and money spent on works is counted once, including after the next valuation.
Funds show capital calls, distributions and the multiples TVPI, DPI and RVPI: total, returned and remaining value against capital paid in. J-curves use templates for mature funds and each vintage.
Six reporting tools in the console
There are two parts: Insights for analysis and Reports for finished reports, both reading the same checked ledger your team has reconciled with the bank.

You build a reportin three steps.
The same steps work for a monthly summary and a one-off question from the investment team.
-
Choose the scope
Pick the entity or group, the period and the reporting currency.
-
Build or reuse
Start from a template or saved view, then add the sections the reader needs.
-
Share it
Export a PDF for the family, or a spreadsheet for your team.
Questions about family office reporting.
If your question is not here, ask us during the demo.
Are private assets included in allocation?

Yes. Property, funds and loans sit on the same ledger as the bank portfolios, so they appear in every allocation view and report.
How is performance measured?
A time-weighted return removes the effect of money added or withdrawn, so it shows how the investments themselves did.
What happens when a price is missing?
The holding is flagged and the price shown. A gap in the data never appears in a report as a loss.
What does a guideline check look like?
You set a rule, such as a maximum share in one issuer or one country. A breach is flagged on the home screen.
Can we get the data out?
Yes. Any table exports to CSV or Excel, and finished reports export as PDF.
We can show a reportfor a structure like yours.
We build an allocation view and a report on anonymised data during the demo.